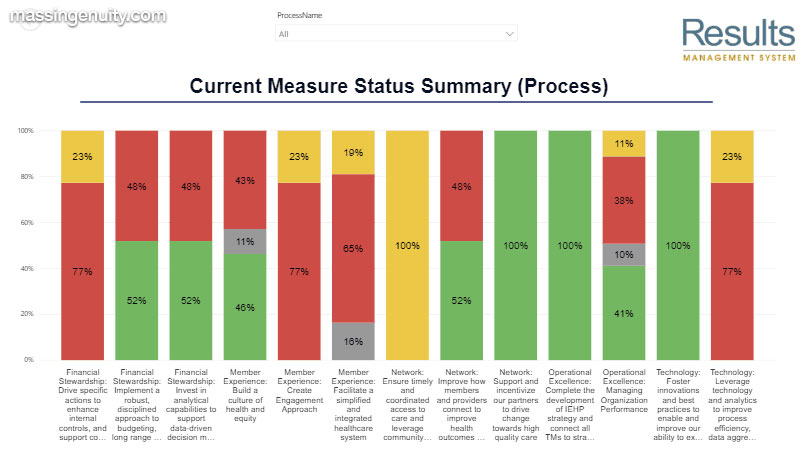
Performance dashboards and data visualization help organizations more clearly see the big picture in real-time and, therefore, more quickly make better decisions. Seeing the big picture is about seeing the connections between core business operations and overall business performance.
In addition, visual learning is the predominant learning style of 70% of the population. Rather than learning primarily with numbers and spreadsheets, people learn best with pictures, diagrams, charts, and graphs. Plus, great data visualization tools are great storytelling tools. The question is what stories do you want to tell about your organization’s performance?
We find that the best stories are those about your customer results, employee innovations, and especially your strategic and operational performance results. Of course, it is important to see trends, hot spots, and roadblocks early enough to intervene to make improvements.
Enterprise performance and data visualization

Data visualization helps you and your team to always be aware of and conversant about your company’s performance.
However, before settling for any business intelligence dashboard, you’ll first have to answer a few basic questions. One vital question is which results are most critical for you and your team?
Also, what are the relationships between our leading indicators of success (process measures) and our lagging indicators of success (outcomes measures)? For example, a very important story is being able to tell how many proposals you submitted to clients this quarter and how many of those converted to revenue? It is all about telling the story that communicates the connection between daily work and long-term outcomes.
It’s important to note that when your data visualization isn’t grounded on the information that is most important for you, implementing even the finest data visualization software out there will be a waste of time. The moment you and your team have effectively determined what is your most critical data, you can then move forward and decide which activities or elements are fundamental to achieving your desired results.
Understanding your data analytics needs
Data visualization is all about storytelling as the story unfolds, not just as the final chapter is written. Business intelligence dashboards are there to help you get the answers you need in a quick and hassle-free manner.

They enable your team to access the necessary information early on so you can make better decisions, initiate improvements in processes whenever required, and help you achieve the results you want. The best big data visualization tools on the market are specifically designed in a series of key tabs, ideally three to five of them. So, when you think of the questions you need answered, and the particular information which will be of use to leadership, middle managers, and frontline teams, what you need to do is understand your business and how data visualization can assist you.
The information they need should identify correlations and data trends over time. All this leads to fully understanding what changes might be necessary or how to allocate resources for rapid improvements.
Chris Barker,
Senior Consultant

