

Excel charts are inadequate. They are not only time-consuming to understand, but are also devoid of transparency, and are in every sense of the word, obsolete. However, when you leverage the formidable power of data visualization, you will always be on track to obtain actionable insights into virtually all aspects of your business.
In turn, this will enable you to effectively support your team, organization-wide, to make strategic decisions quicker. Data visualization comes into play by clarifying your KPIs and helping you demonstrate in real-time whether or not you are on track to achieve business success. It may also support you in formulating and implementing strategic plans that will take your business to the next level. Results Software delivers all this and more in a markedly convenient and hassle-free manner.
1. Effectively Implement Strategic Planning

Regardless of your organization’s actual size and core operations, you’ve time and again sought some specific business information to support your decision-making.
For instance, data-driven insights on your company’s performance. Yet, without the right business intelligence tools, this may prove to be very difficult, and ultimately, frustrating.
You might have pinpointed the information you require, but it is then buried deep in complicated spreadsheets that are hard to analyze.
Run-of-the-mill spreadsheets, at best, deliver rather paltry value when it comes to data analytics. Data visualization captures raw data, models it, and converts it to useful business information, which you can then use in diverse beneficial ways.
Sadly, the data most companies generate is managed by either data analysts or perhaps Excel wizards to only meet the reporting needs of leadership and external stakeholders.
Generally, this information isn’t accessible to the rest of the team across different levels of the organization. Nevertheless, there are 3 key benefits that can be obtained when data is accessible organization-wide.
Data visualization can significantly boost employee engagement and accountability across all levels of your organization.
When you make data available to all your employees, they will certainly feel more empowered and motivated to make data-driven decisions quicker.

In such a scenario, they can rapidly analyze and act on the information generated on nearly all aspects of your business. This may vary from process performance to business strategies or even high priority outcomes.
Such a data-driven culture often culminates in your team gaining a deeper understanding of the various connections between processes and outcomes to perform their duties more effectively and efficiently.
Data visualization will enable you and your team to see the bigger picture much easier.
This is all about the capability to flag connections between your core operations and your overall performance. Seeing the bigger picture clearly leads to rapidly identifying new opportunities for growth.
Data visualization fast-tracks performance improvement
The big question is “how can you get business results quicker?” Data visualization summarizes lots of complex data and makes it available to all levels in your organization in an easy-to-understand format. This real-time visibility of highly relevant information fast-tracks learning by flattening the learning curve and significantly shortens the continuous improvement cycle.
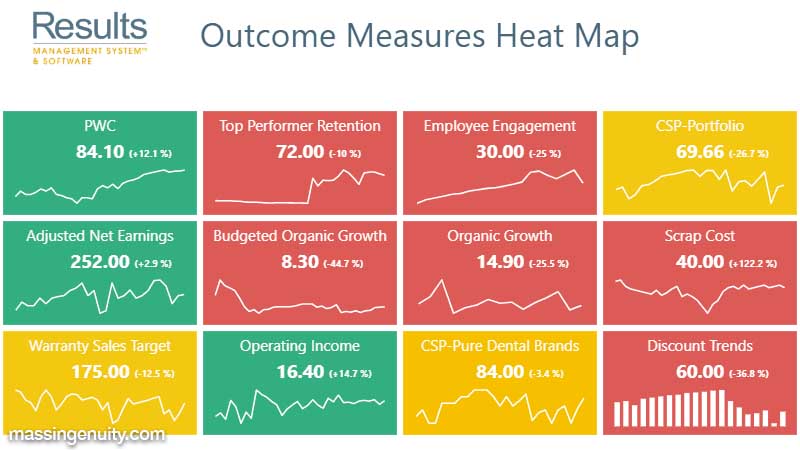
Dashboards and managing your strategic plans deployment
When it comes to enterprise performance management, one of the most critical factors to consider is strategic planning.
Without strategic initiatives, it becomes almost impossible for your company to truly perform at a high level. More often than not, many organizations do a great job in formulating strategic plans. Still, the biggest problem lies in the actual implementation of strategic initiatives. There is nothing more futile than failing to execute a great business plan.
One of the key factors behind this is lacking visibility of all strategic initiatives simultaneously.
Many companies can’t efficiently track the real-time status of all critical tasks they undertake.
Without visibility, accountability is weak, execution then becomes inconsistent, and eventually, small issues evolve into big problems. Data visualization can be immensely useful in eliminating these challenges.
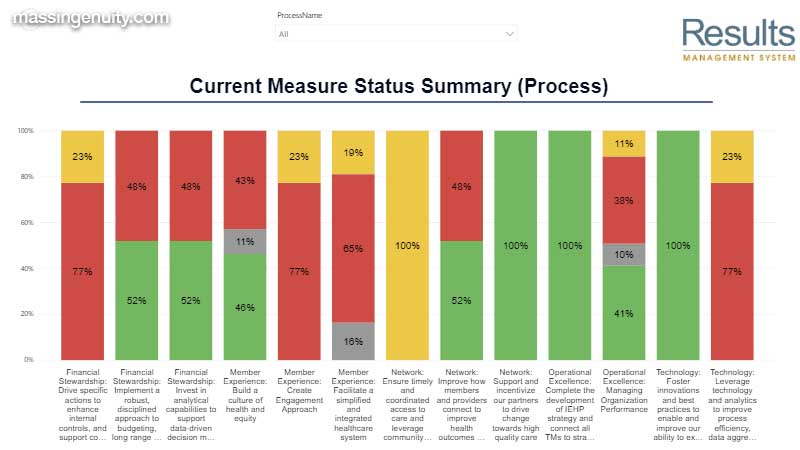
Well-designed dashboards can help you to efficiently keep track of the real-time status of your strategic goals. Not to mention providing the capability to drill down to the process measures that have been initiated to meet those objectives, and the priority for their execution.
In case a measure is off track, you and your team can instantly identify it and take the necessary actions.
This facilitates a multidimensional view of spotting risks and mitigating constraints whenever they crop up. Data visualization pulls data from multiple sources, models in a manner that helps you rapidly determine and analyze issues, allocate resources, take action to drive improvements, and ultimately, achieve your strategic goals.