Modern corporations thrive on capturing and using the data available to them to improve operations, save money and work more efficiently. But data is nothing without the tools needed to translate massive amounts of information into manageable, meaningful insights.
Data visualization is an essential tool for translating data into insights. But not all data visualization tools are created equal. When you search for management software to power your business, make sure you’re choosing an option that offers rich data visualization tool capabilities.
Here’s more on how quality performance management systems with high-quality data visualization tools can make a difference in your business.

What is Data Visualization?
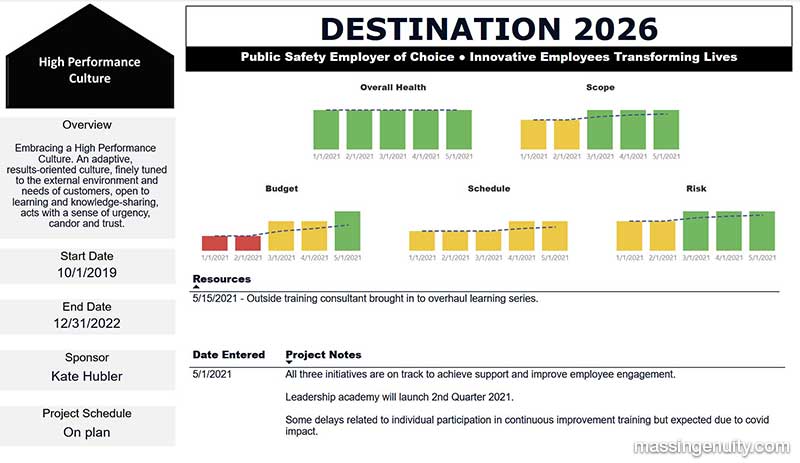
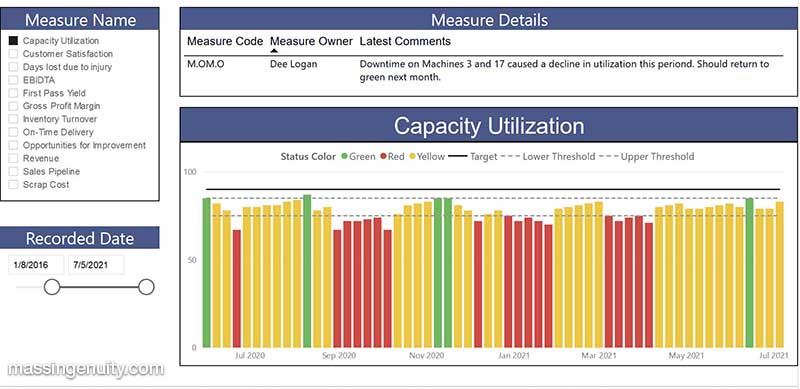
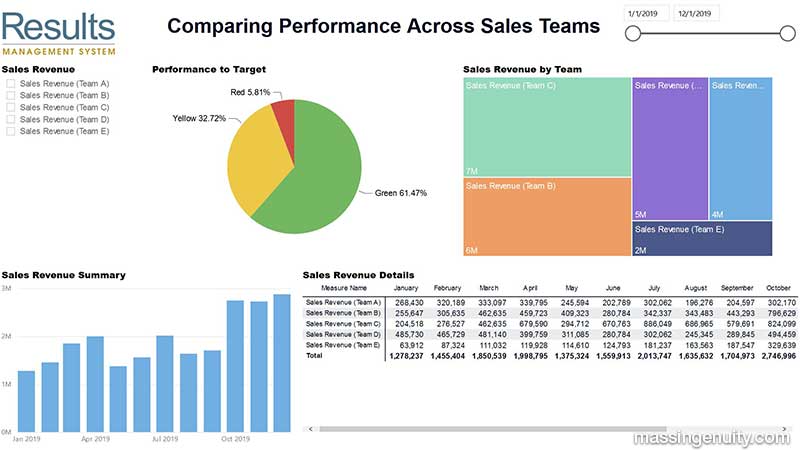
Data visualization is a feature of management software that converts large amounts of data into graphs, charts, and other visuals.
Think about all of the individual data points that are available to your business — data related to productivity, expenses, revenue, profit margin and more.
Collectively, this data can be overwhelming. Large amounts of data are unwieldy and difficult to process without expert knowledge. That’s where data visualization comes in. An effective data visualization tool can process massive amounts of data and make clear at a glance the meaning of that data.
The 4 Ways a Data Visualization Tool Empowers Your Business
Most data visualization tools offer a series of different types of visuals. These visual options should help tell a story about your business, and they can be helpful in the following ways:
- Setting Goals: For goals to make a difference in your company’s operations, they must be realistic. A quality data visualization tool can demonstrate at a glance how your company has performed traditionally or recently, allowing you to develop goals that are within reach.
- Tracking Trends: The best data visualization tool suites make clear the trends that are influencing your business — for better or worse. You obviously want to identify and reverse negative trends, while building on positive trends. The right data visualization tool can help you do that.
- Demonstrating Success: Whether you’re sharing information with the company’s executive leadership team or a prospective client, a data visualization tool can help demonstrate how and where you’ve been successful.
- Showing Opportunities: For a company to grow, it must always be aware of new opportunities. A quality data visualization tool can show your team where opportunities await, supporting the company’s growth.

Above, you see mention of the “right” data visualization tools and “quality” data visualization tools. Unfortunately, some management software includes data visualization tools that muddle your view of corporate operations or that provide misleading information. Some data visualization tools simply don’t have enough features and options to support your business needs. For example, it’s not enough to offer graphs and charts. You need the right style of graph or the right type of chart to quickly display information relevant to your company and its performance.
Because there are data visualization tool options of varying quality, your team should pour time, effort, and energy into ensuring you choose the best option from among performance management systems.
Discover Powerful Data Visualization Tools With Results Software

At Mass Ingenuity, we placed a special focus and emphasis on data visualization when developing our Results Software.
We invested a disproportionate amount of our time, testing, and research into this aspect of our management software so that we could provide industry-leading data visualization.
The outcomes of that time, testing, and research are powerful data visualization tools that empower our users to:
- Analyze company performance daily, weekly, monthly and quarterly.
- Discover both leading and lagging indicators of success to inform business decisions.
- Share meaningful stories with both internal and external audiences.
- Model and optimize the value your company delivers.
You likely have existing business tools in place. Results Software and its data visualization tools fill the reporting gaps present in your existing tools, giving your company and its leadership team a better picture of current performance — and how to consistently improve it. With data visualization tool options like those available within Results Software, your company can reinforce its competitive advantages, remain nimble to take advantage of new opportunities, and deliver products and services of the highest quality to customers.
Get the Results Your Company Desires
Users of Results Software typically experience dramatic changes in performance: 25% or more increases in sales, 35% or more decreases in costs, and 70% or more increases in net profit.

Is your company ready to improve performance and maximize its potential?
Get started by choosing the right Results Software plan for your business.
Scott Harra
Executive Vice President Of Marketing And Government Relations

